LuyenIELTSOnline

Luyện Tập Viết & Bài Mẫu Writing Task 1

Luyện Tập Viết & Bài Mẫu Writing Task 1

Riverside Town

Riverside Town
T4, 10/10/2018

The maps below show the changes experienced by Riverside town from 1970 to 2009. Summarise the information by selecting and reporting the main features, and make comparisons where relevant.
Consumer spending

Consumer spending
T7, 06/10/2018

The table below gives information on consumer spending on different items in five different countries in 2002. Summarise the information by selecting and reporting the main features, and make comparisons where relevant.

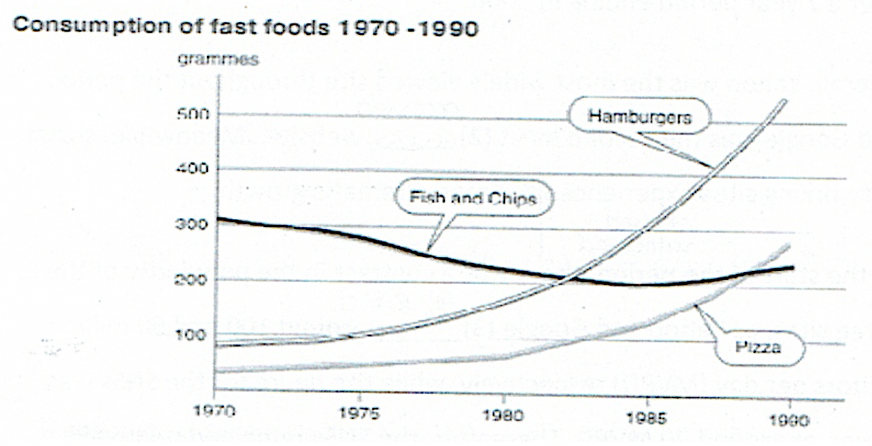
Consumption of fast foods 1970-1990

Consumption of fast foods 1970-1990
T6, 05/10/2018

The chart below shows the amount of three different fast foods consumed per person per week in a European country. Summarise the information by selecting and reporting the main features, and make comparisons where relevant.
An island

An island
T4, 10/10/2018

The maps below show an island, before and after the construction of some tourist facilities. Summarise the information by selecting and reporting the main features, and make comparisons where relevant.

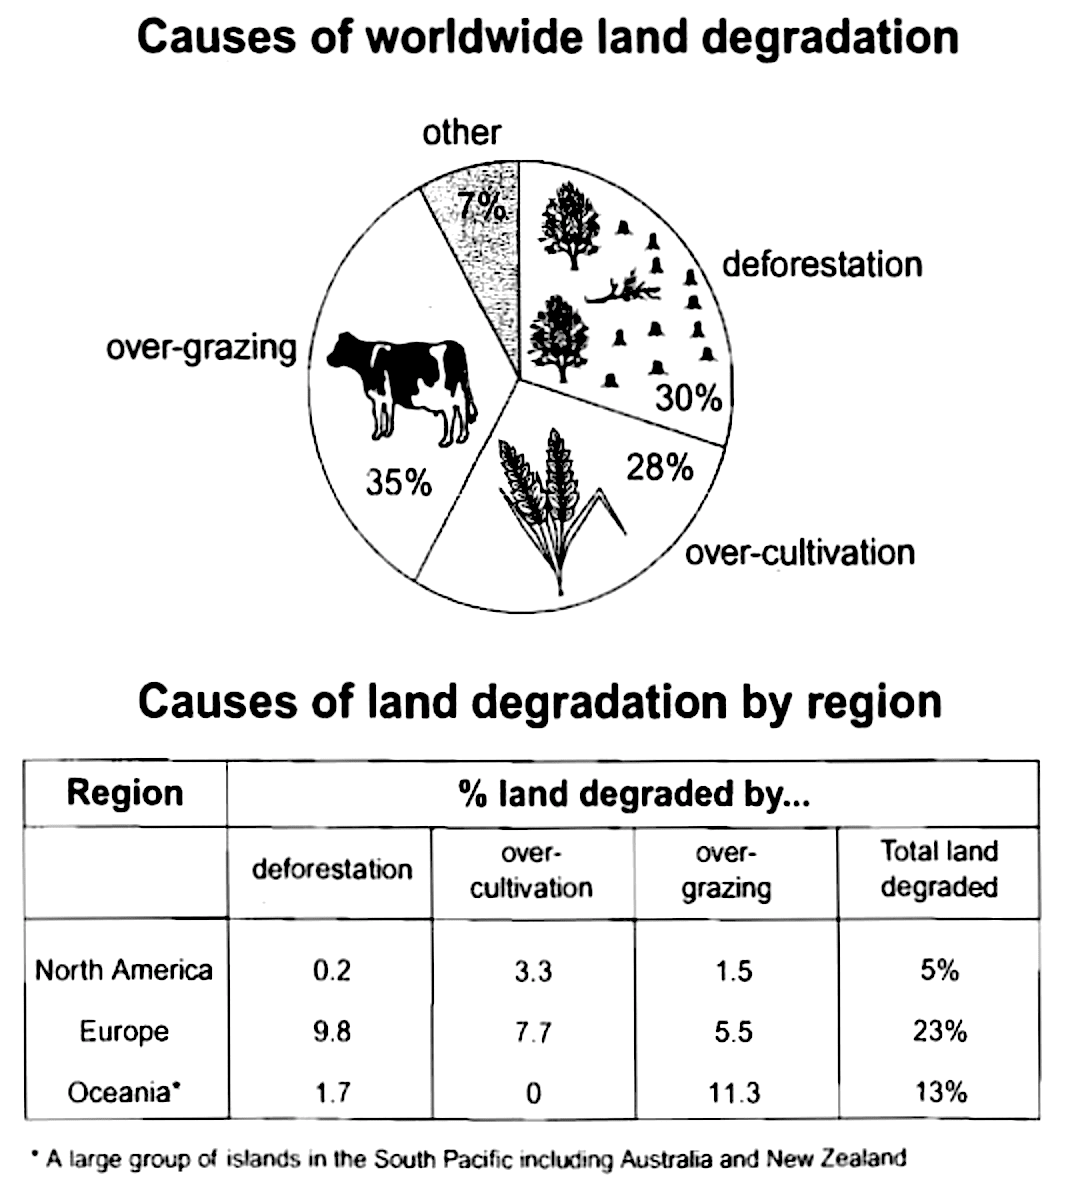
Land degradation (Table + Pie chart)

Land degradation (Table + Pie chart)
T2, 08/10/2018

The pie chart below shows the main reasons why agricultural land becomes less productive. The table shows how these causes affected three regions of the world during the 1990s. Summarise the information by selecting and reporting the main features, and m

Sales of coffee and bananas

Sales of coffee and bananas
CN, 07/10/2018

The tables below give information about sales of Fairtrade*-labelled coffee and bananas in 1999 and 2004 in five European countries. Summarise the information by selecting and reporting the main features, and make comparisons where relevant.

A City Hospital

A City Hospital
T4, 10/10/2018

The two maps below show road access to a city hospital in 2007 and in 2010. Summarise the information by selecting and reporting the main features, and make comparisons where relevant.
Crime rates in Newport city

Crime rates in Newport city
T2, 05/11/2018

The chart below shows the changes that took place in three different areas of crime in Newport City centre from 2003 - 2012. Summarise and information by selecting and reporting the main features and make comparisons where relevant.