
Đề ngày 25/4/2019: Car sales
(Reading time: 1 - 2 minutes)
Đề ngày 25/4/2019
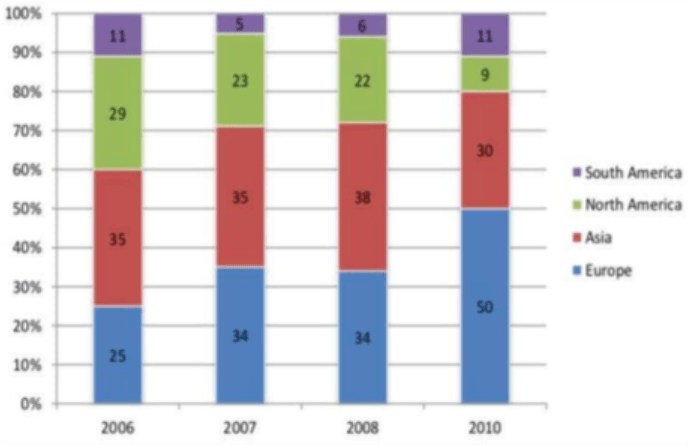
The chart shows the percentage of car manufacturer's total car sales in different regions from 2006 to 2010.
Summarise the information by selecting and reporting the main features, and make comparisons where relevant.
Write at least 150 words