Sample answer
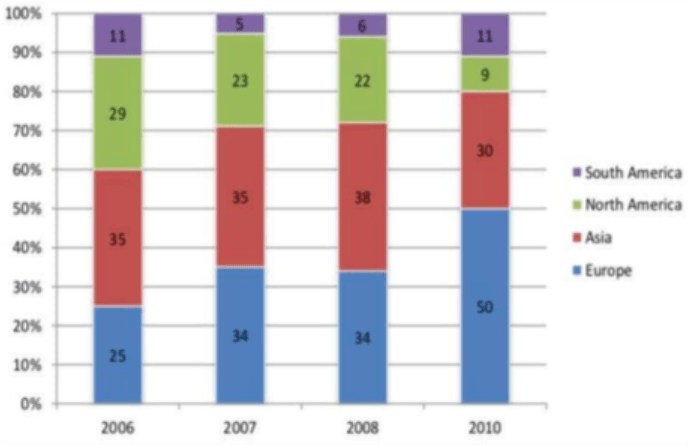
The chart gives information about the proportion of car sales of automobile manufacturers in four particular regions in the world between 2006 and 2010.
Overall, the two largest car consumption markets throughout the period were Europe and Asia. The percentage of car sales in North America experienced a downward trend while that of South America remained low with a slight fluctuation.
In the beginning, Asia achieved the highest proportion of total car sales, standing at 35%, and Europe accounted for exactly a quarter. After increasing to 34% in the next year and levelling off in 2008, the figure for Europe went up rapidly and overtook that for Asia in the final year, accounting for a half of total car sales and becoming the largest market of car consumption. The percentage of car sales in Asia remained constant in 2007, increasing modestly by 2% in the next year and falling to nearly a third of total car sales in the last year.
There was a fall in the percentage of car sales in North America over the surveyed period, dropping from 29% in 2006 to around 22% in the next two years and declining significantly to just under 10% in 2010. Meanwhile, car sales in South America contributed only a small minority to the total car sales, standing at 11% in 2006, halving in the next two years. Interestingly, the figure thereof for the year 2010 is the same with that for the first year.