
Đề ngày 3/2/2018: Household income and spending
(Reading time: 1 - 2 minutes)
Đề ngày 3/2/2018
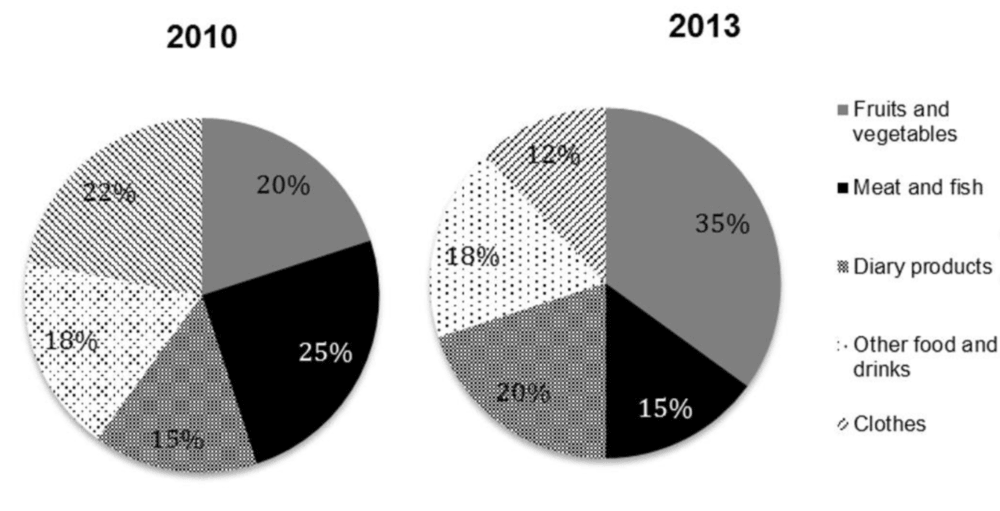
The table and pie charts below give details about household income and spending on food and clothes by an average family in one UK city in 2010 and 2013.