Sample answer
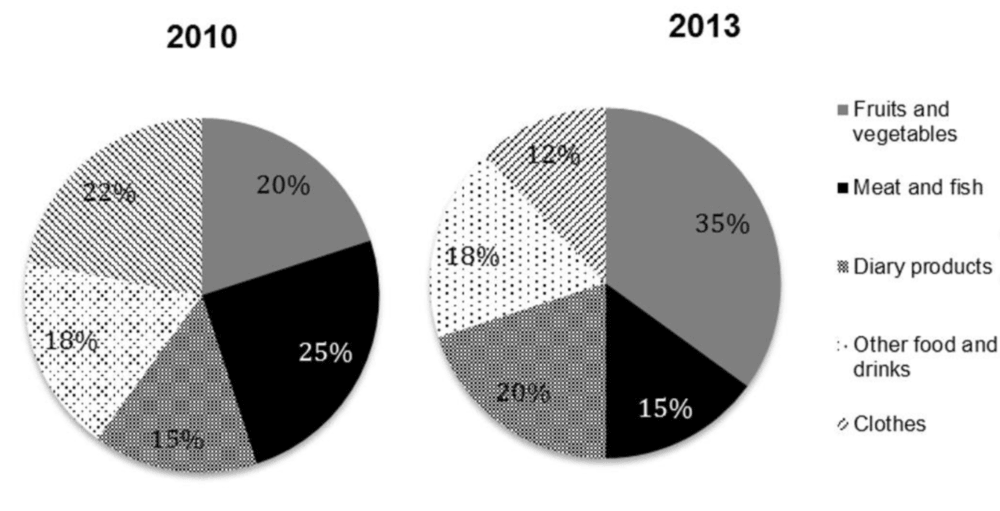
The table gives information about the total household income and expenses on food and clothing of a normal British family in an urban area in 2010 and 2013. Meanwhile, the two pie charts illustrate the proportions of household spending allocation in five
Overall, the total household income showed a remarkable decrease, as opposed to the upward trend of spending on food and clothes. More household budget allocated on fruits and vegetables, and dairy products, while less money spent on meat and fish, and it.
It is clear that the annual household income of an average British family in a city decreased markedly by £4000, whereas spending on food and clothes increased slightly by £1000
Turning to the pie charts, in 2010, there was a significant growth in the percentage of annual household expenditure on fruits and vegetables, accounting for 20% in 2010 and making up the largest proportion with over a third in 2013. More household budget also spent on dairy products with a 5% increase over the three-year period, and this product category made up the second largest proportion in 2013. In contrast, meat and fish, and clothes witnessed a great fall by 10% for both, while the figure for other food and beverage remained unchanged at 18% in the two years.