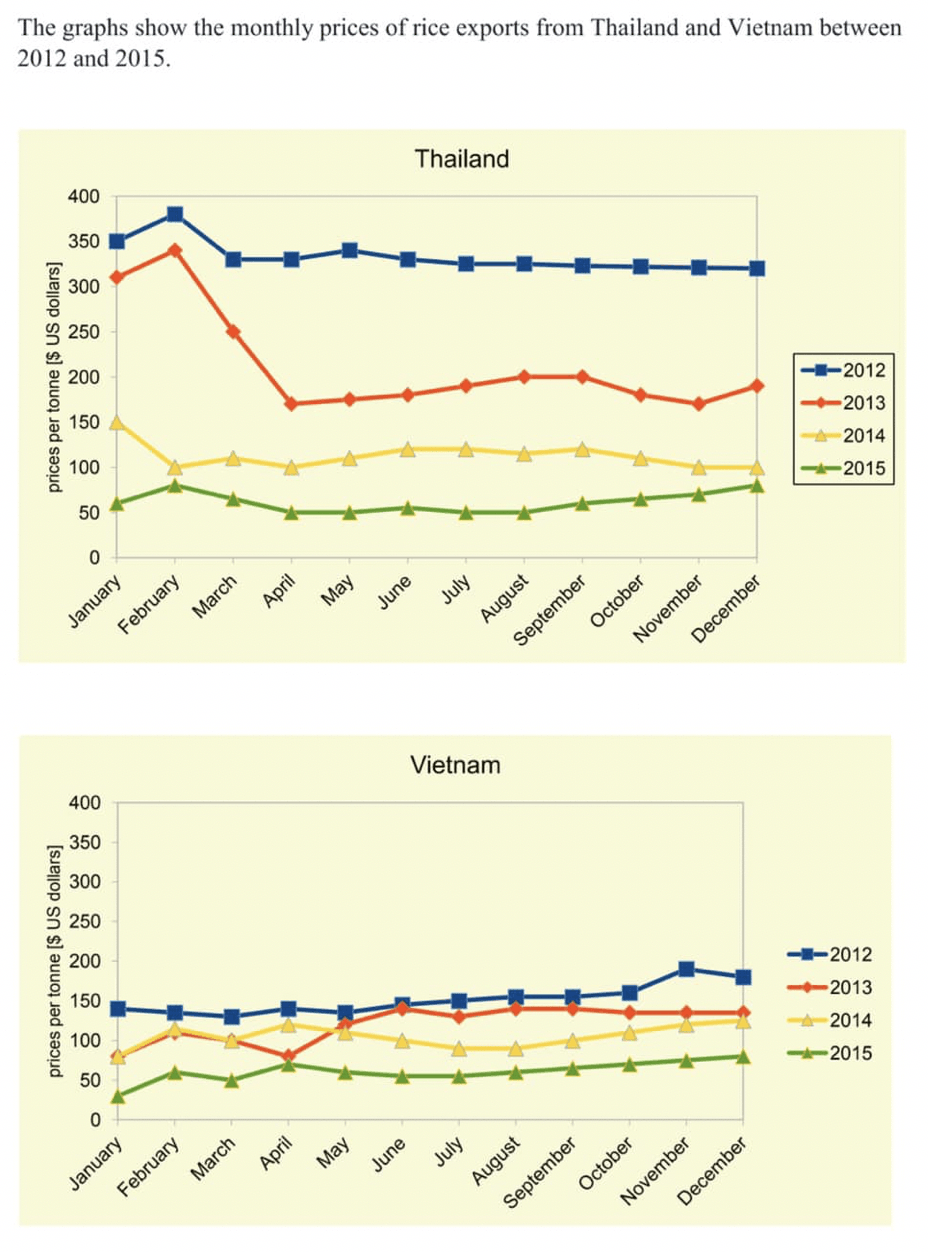
Đề ngày 20/6/2020: Rice exports from Thailand and Vietnam
(Reading time: 1 - 2 minutes)
Đề ngày 20/6/2020 (đề này được đánh giá là một đề khó)

Bạn có thể xem mẫu kết quả sửa bài của
> Mẫu sửa bài IELTS Writing Task 1
> Mẫu sửa bài IELTS Writing Task 2
Nào hãy lựa chọn 1 trong các chủ đề bên dưới để bắt đầu làm bài nhé

Đề ngày 20/6/2020 (đề này được đánh giá là một đề khó)
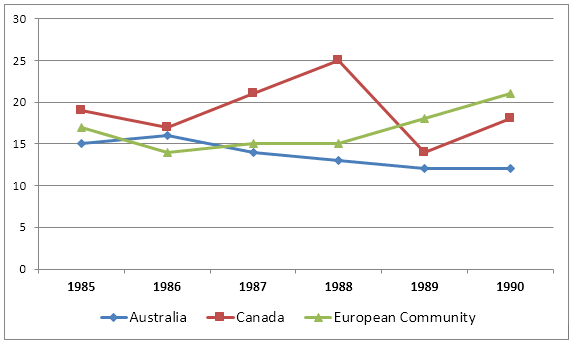
The graph below shows the differences in wheat exports over three different areas.
Summarise the information by selecting and reporting the main features and make comparisons where relevant.
Write at least 150 words
Đề ngày 18/08/2018
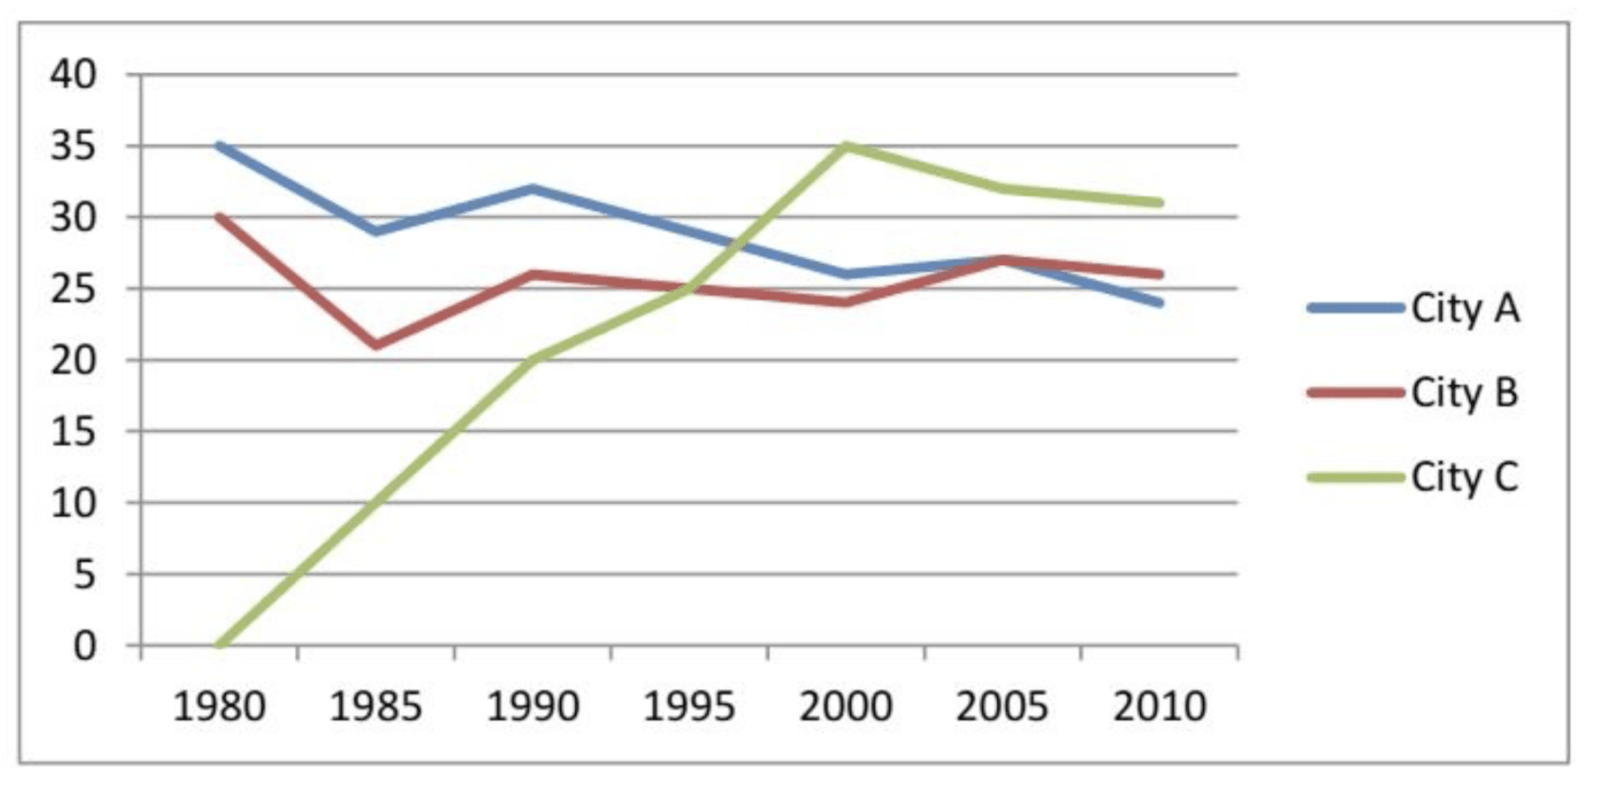
The graph shows the information about international conferences in three capital cities in 1980 – 2010
Summarise the information by selecting and reporting the main features, and make comparisons where relevant.
Đề ngày 21/07/2018
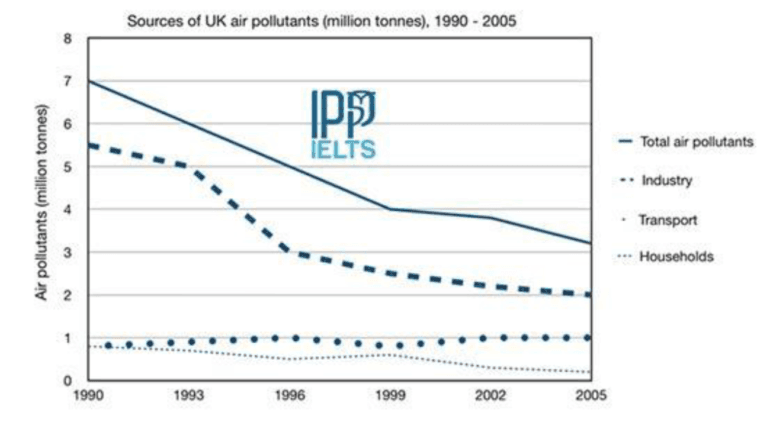
The graph below shows different sources of air pollutants in the UK from 1990 to 2005.
Summarise the information by selecting and reporting the main features, and make comparisons where relevant.
(Phần biểu đồ nguồn lấy từ report báo về trên trang ipp ielts)
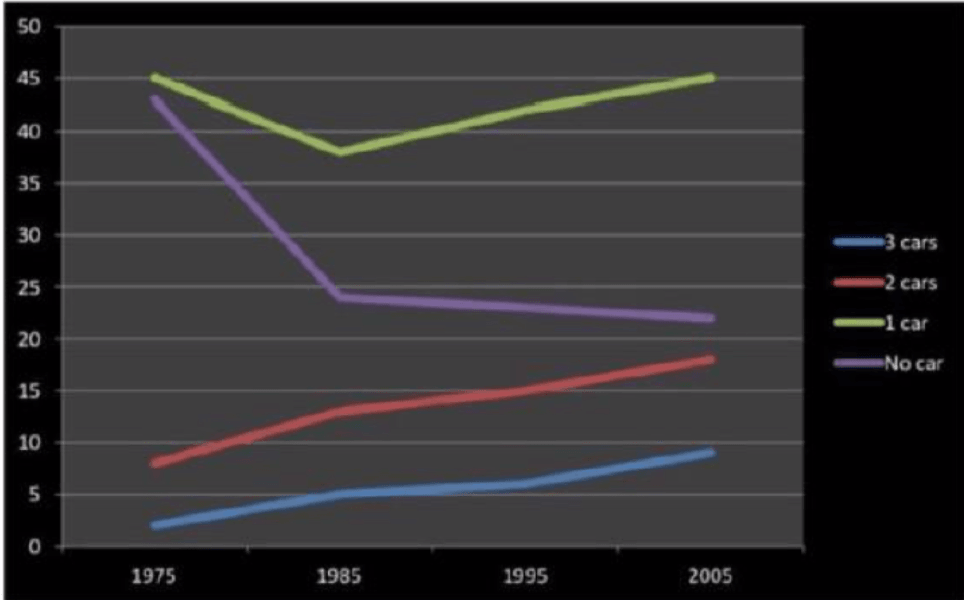
Đề ngày 11/05/2019
The chart below gives information about car ownership per household in the UK from 1975 to 2005, measured in percentage.
Summarise the information by selecting and reporting the main features, and make comparisons where relevant.
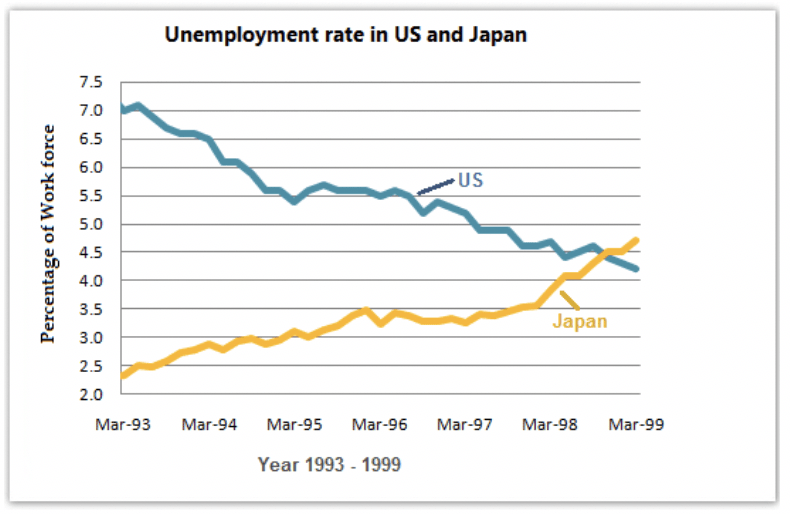
The graph below shows the unemployment rates in the US and Japan between March 1993 and March 1999.
Summarise the information by selecting and reporting the main features, and make comparisons where relevant.
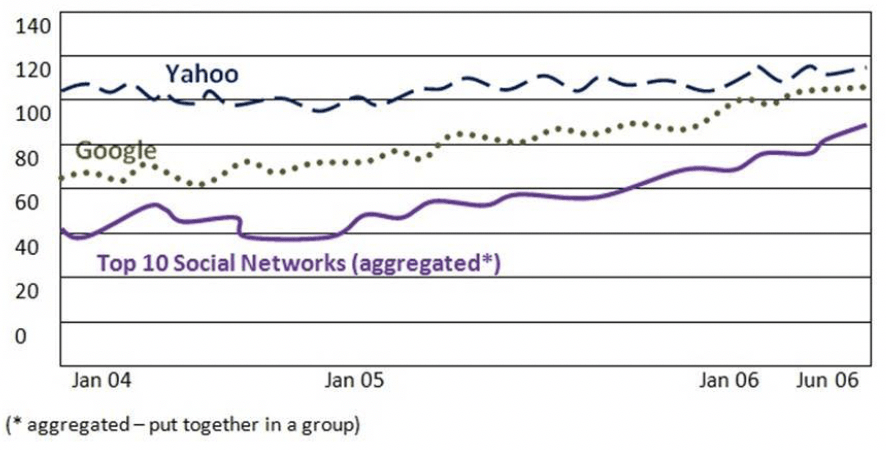
The graph below shows the popularity of social networking sites compared to two internet search engines in the USA from January to June 2006.
Summarise the information by selecting and reporting the main features, and make comparisons where relevant.
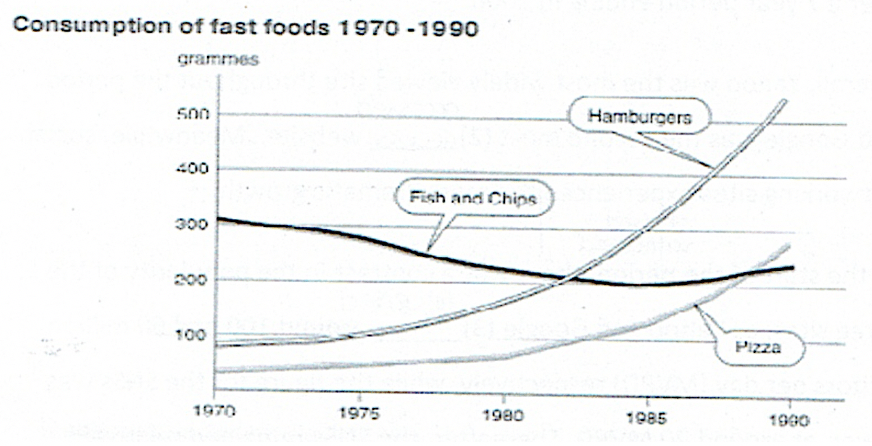
The chart below shows the amount of three different fast foods consumed per person per week in a European country.
Summarise the information by selecting and reporting the main features, and make comparisons where relevant.
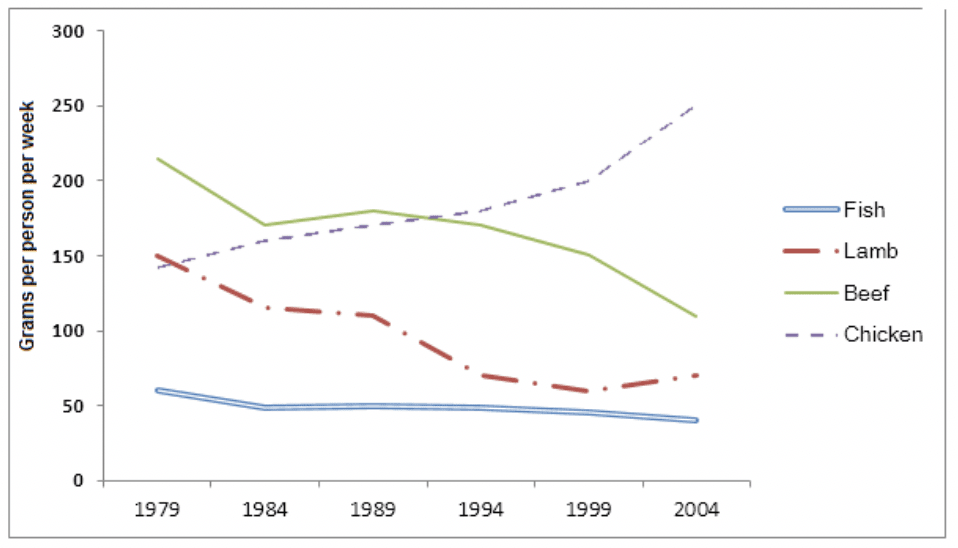
The graph below shows the consumption of fish and different kinds of meat in a European country between 1979 and 2004.
Summarise the information by selecting and reporting the main features and make comparisons where relevant.
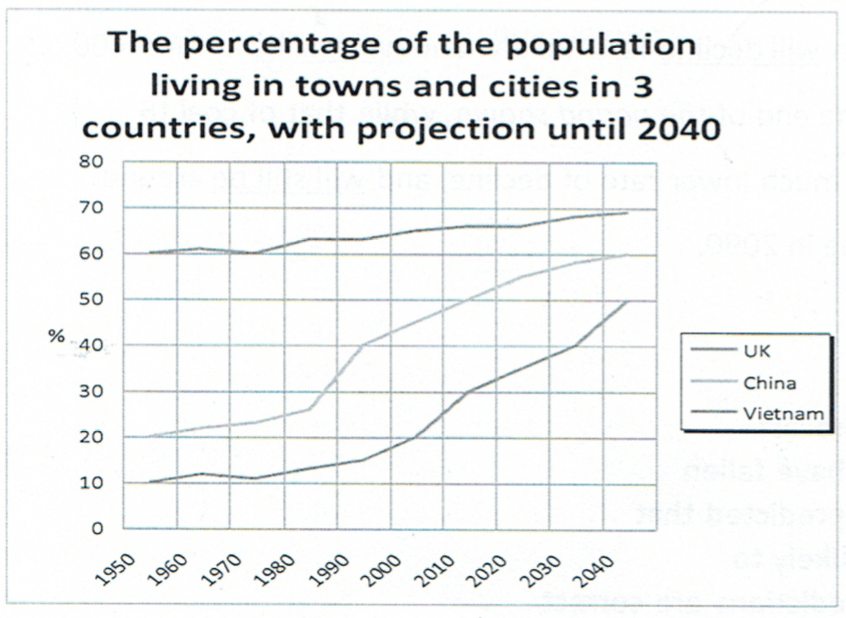
The chart shows the percentage of the population living in towns and cities in 3 countries, with a projection until 2040.
Summarise the information by selecting and reporting the main features and make comparisons where relevant.