(Reading time: 2 - 3 minutes)
Đề ngày 21/07/2018
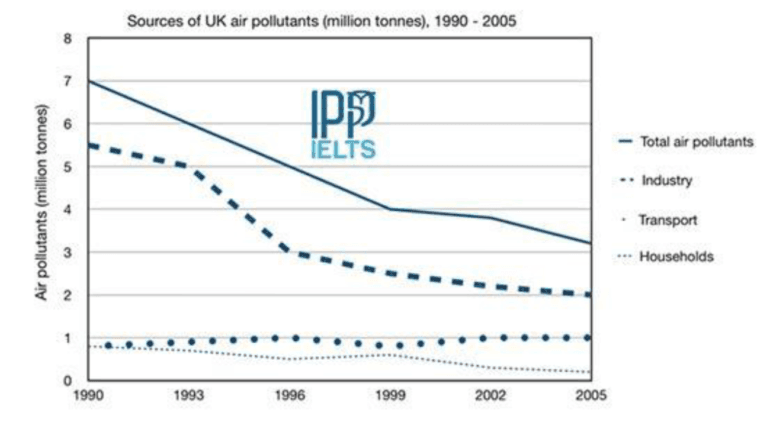
The graph below shows different sources of air pollutants in the UK from 1990 to 2005.
Summarise the information by selecting and reporting the main features, and make comparisons where relevant.
(Phần biểu đồ nguồn lấy từ report báo về trên trang ipp ielts)
Write at least 150 words
Sample answer
| Mở bài: paraphrase lại đề |
The line graph gives information about the quantities of air pollutants generated from three particular sources in the UK between 1990 and 2005.
|
|
Overview:
- Nói tổng lượng air pollutant giảm trong toàn thời kỳ
- Phần lớn ô nhiễm không khí gây ra bởi industry
- Transport & households là nguồn thiểu số gây ra ô nhiễm không khí
|
Overall, it can be seen that the total amount of air pollutants in the UK decreased over the surveyed period. Most air pollution came from industry and the all-time downward trend thereof was particularly significant. In contrast, transport and household activities caused only a minority of air pollutants. |
|
Thân bài:
Viết 1 đoạn nhận xét về line total (cứ biểu đồ nào có line total bạn cứ viết riêng 1 đoạn về nó, nhận xét từ đầu kỳ đến cuối kỳ là xong)
|
In 1990, the air in the UK was polluted by a total of 7 million tonnes air pollutants produced from different sources in the UK. The next 9-year period witnessed a rapid fall in the number of air pollutants, dropping to 4 million tonnes. The total figure of air pollutants then reduced slightly in the remaining years, ending at just over 3 million tonnes. |
|
Viết 1 đoạn nhận xét về line industry:
- Đầu kỳ, industry là nguồn gây ô nhiễm không khí lớn nhất
- Toàn bộ giai đoạn tiếp theo chứng kiến xu hướng giảm --> giảm nhẹ trong 3 năm --> giảm mạnh vào năm 1996 --> cuối kỳ giảm còn 2 million
|
In the beginning, industry was by far the most noticeable source of pollution in the UK, producing approximately 5.5 million tonnes air pollutants. Then, the whole period underwent a decrease in the amount of air pollutants coming from industry, in which after a modest fall lasting over three years, the figure dropped rapidly to 3 million tonnes in 1996. By the end of the period, industry had produced around 2 million tonnes air pollutants. |
|
Viết 1 đoạn nhận xét về 2 lines: household + transport:
- Số liệu của transport & households duy trì mức thấp ở toàn thời kỳ
- Dữ liệu của transport không có nhiều sự thay đổi, số liệu năm đầu & năm cuối gần như giống nhau
- Trong khi đó, dữ liệu của households thì có sự dao động nhẹ theo chiều hướng giảm, chạm xuống 0.1 million
|
In contrast, the rates of transport and households remained low throughout the period. The data on transport experienced little change until the last year, in which its figure of around 1 million tonnes in 1990 is relatively similar with the figure for the final year. Meanwhile, the number of air pollutants coming from households marginally fluctuated around a downward trend, reaching only around 0.1 million tonnes in 2005. |