Sample answer
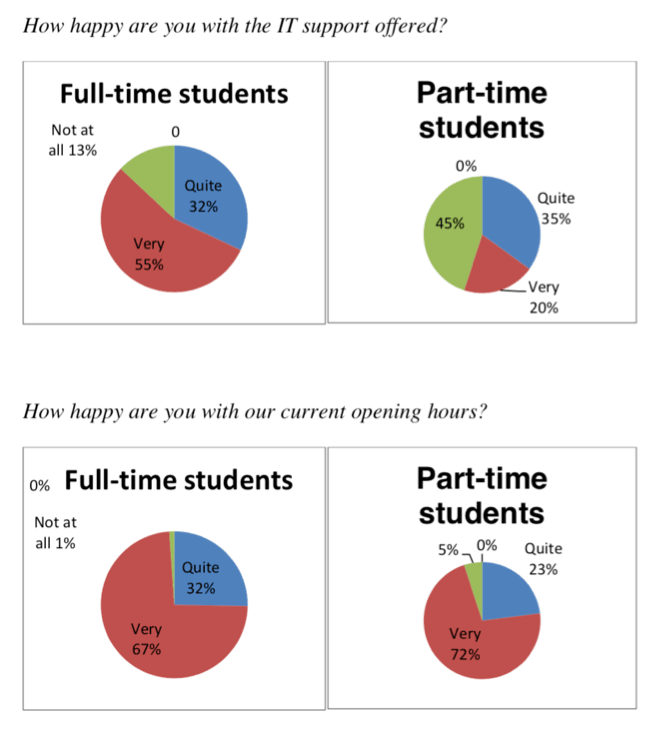
The pie charts give information about the results of a survey carried out by a university library to figure out the viewpoints of full-time and part-time students regarding its IT assistance service and operating hours.
Overall, more full-time students were pleased with the IT support service rather than part-time students. Meanwhile, most students in both groups showed the high level of satisfaction with the library’s opening hours.
There was a remarkable contrast in the opinion concerning IT support, in which above half of full-time students were happy with the service, whereas only a fifth of part-time students had the same opinion. A great majority of part-time student group (45%) was unhappy at all with the service, while only a small minority of full-time students (13%) thought so. Around a third of students in both groups thought that IT support service functioned quite well.
A very large majority of students in both groups happily agreed with the current operating hours of the library, with 67% and 72% for full-time and part-time students respectively. Almost a third of full-time students were quite happy with this service, whereas nearly a quarter of part-time students had the same idea. Only an extremely small minority of students, less than 5%, were not satisfied at all.